Introduction: water chemistry is a function of age
In #14 we saw how to measure the age (residence time) of groundwater — isotopes for the recharge source, tritium and ⁸⁵Kr for the age. What we obtained there was a “clock for water.” This article reuses that clock as a time axis for chemical change. The question is this:
How many years does it take for groundwater to mature chemically? How does the chemistry of young water differ from that of old water?
In #11 we saw that “rain and soil CO₂ dissolve rock (dissolution),” and in #12 and #13 that “components concentrate in stagnant zones.” #15 ties these into a single line: it follows the progress of water–rock reaction — the “maturation” of water chemistry — along a residence-time axis, using PHREEQC. We first reproduce the “maturation” with equilibrium calculations, and then push into what is still missing to solve the system quantitatively — the division of labor between reaction and transport. The stage is Kirishima, a group of volcanic springs. Every ingredient is public data (the public tables of Ide et al. 2018 and a public thermodynamic database).
The setting: the springs of the Kirishima volcanic group
The Kirishima volcanic group in southern Kyushu is covered by Quaternary volcanic rocks, mainly andesite. The dominant mafic minerals are two pyroxenes (augite and hypersthene), and the dominant felsic mineral is plagioclase (Ide et al. 2018). Slightly acidic water, charged with rain and soil CO₂, slowly passes through these fresh volcanic rocks.
What makes this site decisive is that the residence time of each spring has already been measured. From repeated observations of CFCs (chlorofluorocarbons) and a lumped parameter model (LPM), Ide et al. (2016) estimated the mean residence time of the Kirishima springs at 1–58 years (Ide et al. 2016). In other words, this is a rare natural laboratory where “how far the chemical change has progressed” can be matched against “measured residence time.”
Another feature is the high dissolved silica (DSi). The DSi of the Kirishima springs is 0.41–1.45 mmol/L (median 0.93), reaching 3–9 times the world river-water average (0.158 mmol/L) (Ide et al. 2018). This is evidence that volcanic glass, pyroxene, and plagioclase are actively dissolving, and it is the leading indicator of this article.
The chemistry of maturation: minerals that dissolve, minerals that settle
Silicate weathering is a tug-of-war between two half-processes.
- Primary minerals dissolve (undersaturated, SI < 0). Pyroxene, plagioclase, and volcanic glass break down into acid (H⁺) and water, supplying Ca²⁺, Na⁺, Mg²⁺, dissolved silica, and alkalinity to the water.
- Secondary minerals settle (supersaturated, SI > 0). The Al and Si that dissolve out can barely stay in solution; they return to the solid phase as clay minerals.
What matters is that the “type” of secondary mineral that settles shifts as the reaction progresses. The classical weathering sequence (Garrels & Christ 1965) teaches this: in the very dilute early stage, gibbsite (aluminum hydroxide) forms first; as silica accumulates, kaolinite; and as cations accumulate further, smectite becomes stable. This “passing of the baton” is the fingerprint of chemical maturation.
Below, we verify this picture with PHREEQC (database llnl.dat) in two stages.
The saturation index SI = log(IAP/K) tells whether the water is supersaturated (SI > 0, can precipitate) or undersaturated (SI < 0, can dissolve) with respect to a mineral. For the detailed meaning of SI and how to use it in PHREEQC, see the sister series PHREEQC from Scratch #10: Mastering the Saturation Index (SI).
Reproduction ①: cross-checking the springs’ saturation indices against the paper
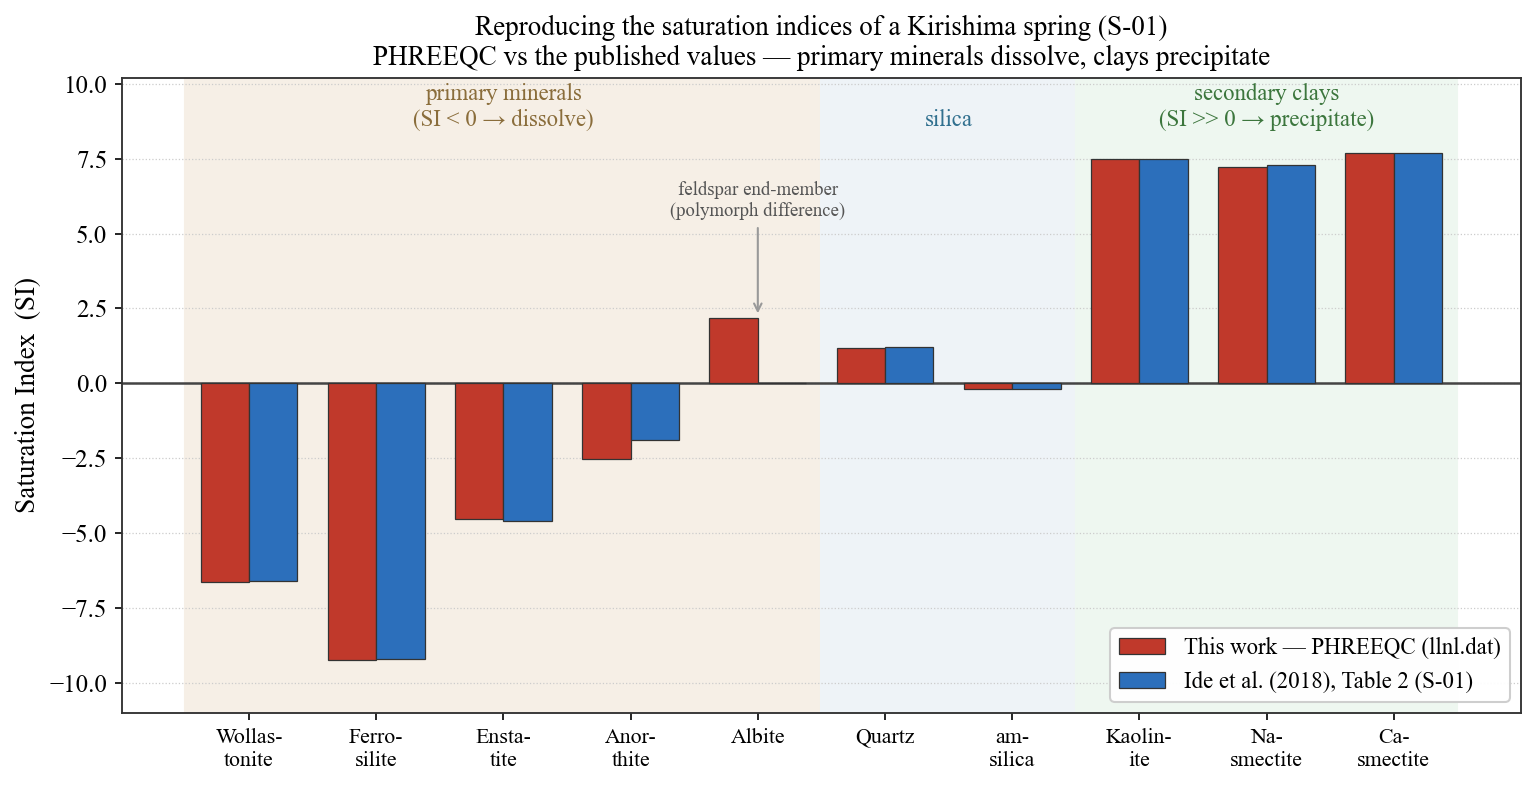
First, we entered every measured item of one representative spring sample (S-01: pH 7.1, Ca–HCO₃ type, DSi 0.97 mmol/L) into PHREEQC and computed the SI of each mineral. The aim is to confirm whether the signs agree with the SI of the same sample listed in the paper’s Table 2 (Figure 1).
The result is clear.
- The primary minerals are all undersaturated: Wollastonite ≈ −6.6, Ferrosilite ≈ −9.2, Enstatite ≈ −4.5, Anorthite ≈ −2.5. Both pyroxene and plagioclase are on the dissolving side.
- The secondary minerals are strongly supersaturated: Kaolinite ≈ +7.5, Ca-smectite ≈ +7.7. The dissolved Al and Si are on the settling side, as clay.
- Silica is quartz-supersaturated and amorphous-silica-undersaturated (Quartz ≈ +1.2, am-silica ≈ −0.2). DSi lies between the saturation of quartz and that of amorphous silica.
These matched the paper’s values almost perfectly (the red and blue bars are nearly the same height). In particular, the fact that the SI of kaolinite and smectite — which depend on the trace dissolved Al — matched exactly is strong evidence that the input, database, and procedure are correct. Only Albite retains a discrepancy of about 2 in SI, but this is a known systematic difference arising from the thermodynamic data of the feldspar end-member (polymorph differences), and it does not affect the skeleton of the weathering story.
Reproduction ②: following “maturation” along a reaction path
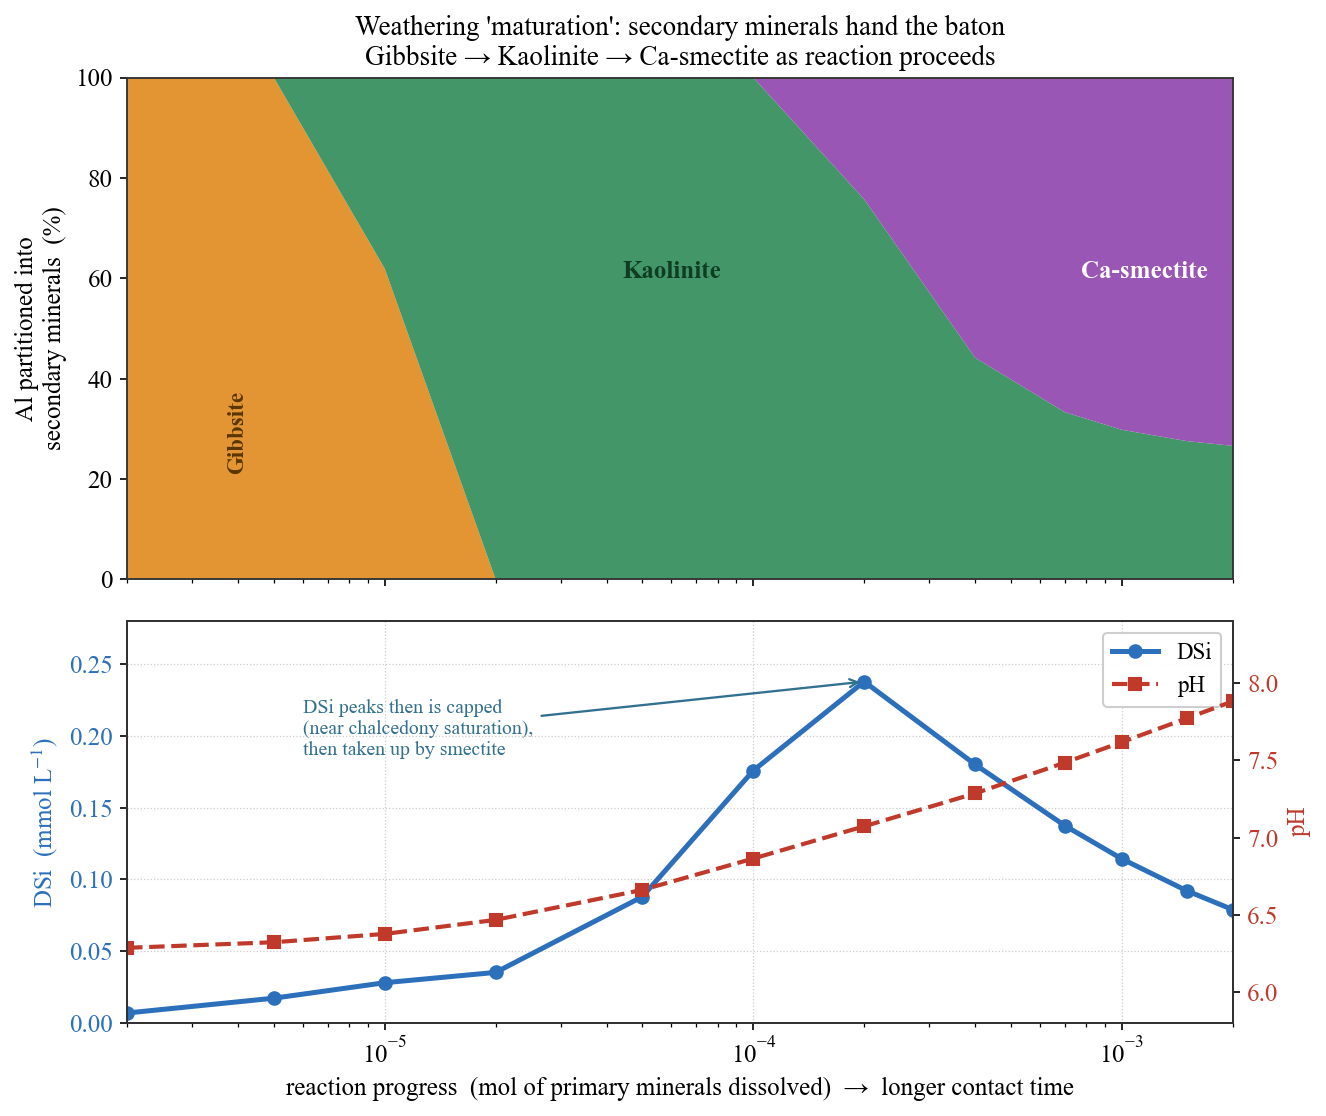
The sign check of SI is a static snapshot of “the water as it is now.” Next we set this in motion along time. Into a dilute recharge water (rain + soil CO₂), we dissolve plagioclase, pyroxene, and volcanic glass little by little (a proxy for contact time), precipitating secondary minerals at equilibrium at each step — a “reaction path” calculation (Figure 2). For an introduction to the method itself, see PHREEQC from Scratch #11: Reaction-Path Modeling.
There are two things to read here.
(1) The three-stage relay of secondary minerals. In the very early reaction (dilute, low silica), gibbsite settles alone first. As silica accumulates, gibbsite redissolves and passes the baton to kaolinite. As cations (especially Ca and Mg) accumulate further, Ca-smectite takes the lead. This is exactly the classical weathering sequence mentioned in the previous section, and the calculation supports from below the interpretation the paper inferred from observation (Ide et al. 2018): “the springs have already experienced gibbsite precipitation, some are in equilibrium with kaolinite, and the more mature waters with Ca-smectite.”
(2) The plateau of DSi. Dissolved silica increases with reaction, but not without limit. It plateaus near quartz–chalcedony saturation, and as the reaction proceeds further, Si is consumed by smectite precipitation and turns to a slight decline. The tug-of-war between “dissolving (Si supply)” and “settling (Si removal)” sets the upper limit of DSi. However, this later decline — the process by which secondary clays take up Si — and the metastability the natural springs show, “silica remaining supersaturated with respect to quartz,” cannot be explained by equilibrium calculation alone. We reconsider this point after looking at the activity diagram and the residence time.
Primary-mineral dissolution is a reaction that consumes H⁺ (e.g., Anorthite + 8H⁺ → Ca²⁺ + 2Al³⁺ + 2SiO₂ + 4H₂O). As the reaction proceeds, the water loses acid and pH rises. By supplying soil CO₂ continuously in an open system, this rise is kept within a realistic range of 7–8.
Where do the springs sit on the weathering diagram?
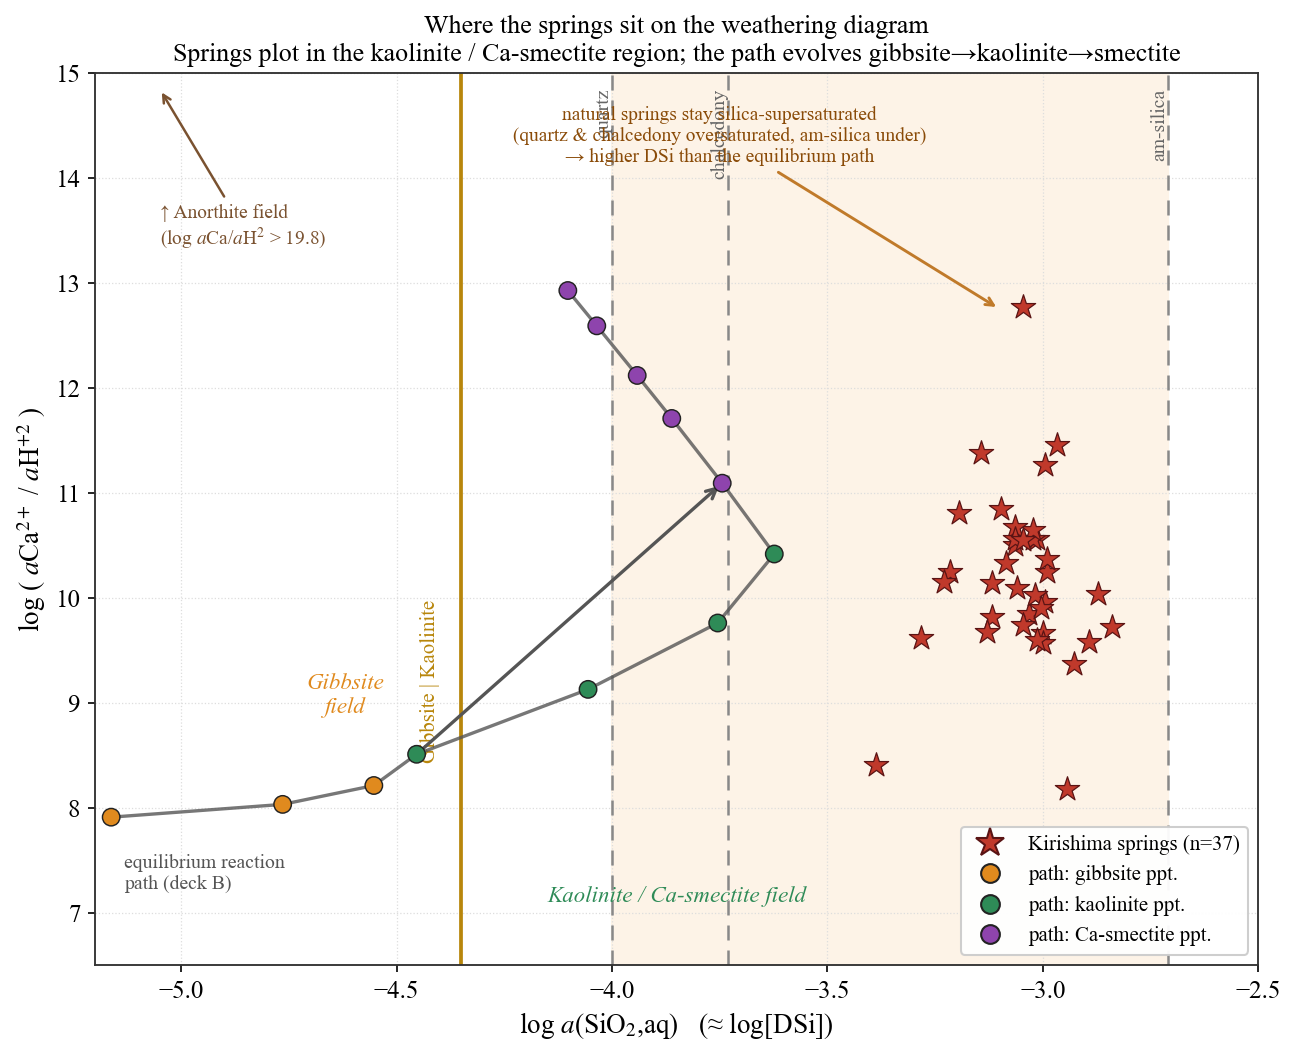
Finally, we plot all 37 springs on an activity diagram (Figure 3). With dissolved silica on the horizontal axis and log(aCa²⁺/aH⁺²) on the vertical axis, this classical diagram lets you read at a glance which mineral is stable. Onto it we overlaid the trajectory of the reaction path from the previous section. The drawing of such solubility diagrams itself is covered in PHREEQC from Scratch #7: Solubility Diagrams (Gibbsite).
Two things can be read.
On the vertical axis, the springs and the reaction path overlap. All 37 springs fall within the band log(aCa²⁺/aH⁺²) ≈ 8–13, which is the region where kaolinite / Ca-smectite is stable. The later reaction path (green to purple points) passes through the same band. The Kirishima springs are precisely water at the stage where clay minerals settle.
On the horizontal axis, the springs shift to the right of the reaction path. The natural springs have higher DSi (right side), lying on the more supersaturated side than the equilibrium reaction path. This is not a failure but a phenomenon the paper itself points out — in natural water, silica remains supersaturated with respect to quartz (kinetic metastability). Because quartz and chalcedony precipitate only slowly, the silica supplied by volcanic-glass dissolution is maintained at high levels. The faint band in the figure (between quartz and amorphous silica) marks this “natural DSi window.”
Equilibrium calculation shows “the endpoint reached given enough time.” When natural water departs from it, the manner of departure becomes information. The horizontal gap here speaks of the kinetic slowness of silica precipitation. Rather than forcing the model to fit the measurements, reading the reason for the gap is far more fruitful geochemically.
A ruler for time: maturation transitions at “about 20 years”
Let us translate the reaction path’s horizontal axis, “reaction progress,” into measured residence time. Ide et al. (2018) matched the SI and activity-diagram analysis against residence time (the 1–58 years of Ide et al. 2016) and concluded that DSi saturation and the kaolinite → Ca-smectite phase transition begin “about 20 years” after recharge.
That is,
- Young water of a few years: still dilute, in the gibbsite–kaolinite stage. DSi is still rising.
- Around 20 years: DSi approaches saturation, and the secondary mineral begins to shift from kaolinite to Ca-smectite.
- Old water of several decades: the Ca-smectite stage. Rich in cations, drifting from Ca–HCO₃ type toward Na–HCO₃ type.
Water chemistry is, literally, a function of age.
The limit of the equilibrium model: why is DSi constant regardless of age?
What equilibrium calculation (Reproduction ②) depicts is “the endpoint the water reaches given enough time.” But the natural Kirishima springs present a fact hard to explain by this endpoint reasoning alone: DSi is held nearly constant (median 0.93, range 0.41–1.45 mmol/L) regardless of residence time (1–58 years), and it stays supersaturated with respect to quartz. By the reaction-path picture, older water should have reacted further and had its DSi slightly reduced by smectite precipitation, so DSi ought to scatter more with age. Why is it nearly constant?
The key lies in the flow regime of this spring system. From CFC analysis, Ide et al. (2016, 2018) judged that the groundwater in this area mixes well during downward flow, with very little piston flow, and estimated residence time using mainly an exponential mixing model (EMM). In other words, what emerges from the spring outlet is not a single water parcel but a mixture of waters of various ages. From here, the DSi plateau can be cleanly organized by separating it into two layers, “value” and “time evolution.”
Why it stops at about 1 mmol (the value). This is decided by chemistry. Mixing merely takes a weighted average of the DSi of waters of each age; by itself it cannot create a plateau — because unless the oldest end-member water is chemically saturated, the average, too, keeps rising. Conversely, the very fact that DSi is capped at a constant value is evidence that the oldest water parcel itself is capped by secondary-mineral precipitation. Ide et al. (2018) attributed this cap to Ca-smectite precipitation. Even in this system where mixing is the lead role (indeed, precisely because mixing is the lead role), it is chemistry that sets the upper limit of DSi.
Why it reaches there in about 20 years and “appears” age-dependent (the time evolution). Here both the speed of chemical reaction and the age distribution (mixing) matter. The observed “apparent residence time vs. DSi” is a convolution of the reaction progress of a single water parcel with the age distribution, and it cannot be tracked by a closed-system equilibrium calculation alone.
Therefore, to solve this system truly quantitatively requires a reactive transport model that couples chemical reaction with mass transport (advection, dispersion, mixing). PHREEQC itself has functions for advection and dispersion, whose basics were introduced in PHREEQC from Scratch #12: Advection–Dispersion Modeling. This article stopped at equilibrium calculation, but the division of labor — “equilibrium tells the endpoint; transport tells the road to it” — is itself the starting point for the next step.
Connection to #12 and #13
This “story of time” runs through the entire water-quality sub-series. In #12 (fluoride) and #13 (arsenic), the high concentrations clustered in the long-residence stagnant zone. In the language of this article, that is “the most matured water.” Water that has drifted toward Na type by ion exchange (#12), become reduced (#13), and matured in its secondary minerals all the way to smectite — on one and the same time axis stand fluoride, arsenic, and the phase transition of silica and clay.
Summary
- Using the Kirishima volcanic springs, we reproduced the “maturation” of water chemistry as a function of residence time with PHREEQC.
- Reproduction ①: we computed the SI of a representative spring and cross-checked against the paper’s Table 2 that primary minerals dissolve (SI < 0) and secondary minerals settle (SI ≫ 0). The SI of kaolinite and smectite matched almost perfectly.
- Reproduction ②: with a reaction-path calculation, we reproduced the “maturation” in which secondary minerals shift through three stages, gibbsite → kaolinite → Ca-smectite, and DSi plateaus at saturation.
- On the activity diagram, the 37 springs fall in the clay-stable region, and we could also read the departure peculiar to natural water — the metastable supersaturation of silica.
- Following Ide et al. (2018), this maturation enters its transition period at about 20 years. Water chemistry is a function of age.
- However, the behavior in which DSi is held nearly constant regardless of age cannot be explained by equilibrium calculation alone in this system where mixing is dominant (with very little piston flow). The upper-limit value of DSi is set by chemistry (Ca-smectite precipitation), and the time evolution toward it is set by the convolution of reaction and mixing. The “endpoint” of maturation is told by equilibrium; the “road to it” by reactive transport (advection) — that is the next step.
All data and results in this article were reconstructed solely from public information (the public tables of Ide et al. 2016, 2018 and a public thermodynamic database). The PHREEQC input decks and figure-generation scripts are designed to match the descriptions in the text, for the purpose of sharing the method.
The PHREEQC methods used in this article are explained one by one, carefully, in the sister series. Readers who want to learn geochemical modeling from the ground up are encouraged to consult it as well.
- #1: Installation and Your First Calculation — the entrance to the series
- #7: Solubility Diagrams (Gibbsite) — how to draw this article’s activity diagram
- #10: Mastering the Saturation Index (SI) — the basis of Reproduction ①
- #11: Reaction-Path Modeling — the basis of Reproduction ②
- #12: Advection–Dispersion Modeling — the road toward the “reactive transport” this article left as homework
- #16: Introduction to Reaction Kinetics (KINETICS) — the next step, treating the “speed” of maturation
Coming next
The homework this article left — a reactive transport model coupling chemical reaction with mass transport — will be treated in earnest in a future installment. In the following #16, we move to the water chemistry of hot springs and geothermal systems and high-temperature water–rock reaction. In a world where the temperature is an order of magnitude different from the low-temperature weathering so far — calcite saturation, the reaction of CO₂ with basalt and andesite — we will see how far PHREEQC can read water chemistry (the basalt–CO₂ reaction itself is also treated in PHREEQC #17 and #18).
References
- Ide, K., Hosono, T., Hossain, S., Shimada, J. (2018) Estimating silicate weathering timescales from geochemical modeling and spring water residence time in the Kirishima volcanic area, southern Japan. Chemical Geology, 488, 44–55.
- Ide, K. et al. (2016) Estimation of residence time of spring waters in the Kirishima volcanic area using CFCs — age analysis by a lumped parameter model (in Japanese). Journal of Japanese Association of Hydrological Sciences, 46(3), 213–231.
- Garrels, R.M. & Christ, C.L. (1965) Solutions, Minerals, and Equilibria. Harper & Row.
- Parkhurst, D.L. & Appelo, C.A.J. (2013) Description of input and examples for PHREEQC version 3. USGS Techniques and Methods, 6-A43.
- Thermodynamic database:
llnl.dat(Lawrence Livermore National Laboratory, bundled with PHREEQC).