Introduction: What PHREEQC Does “Behind the Scenes”
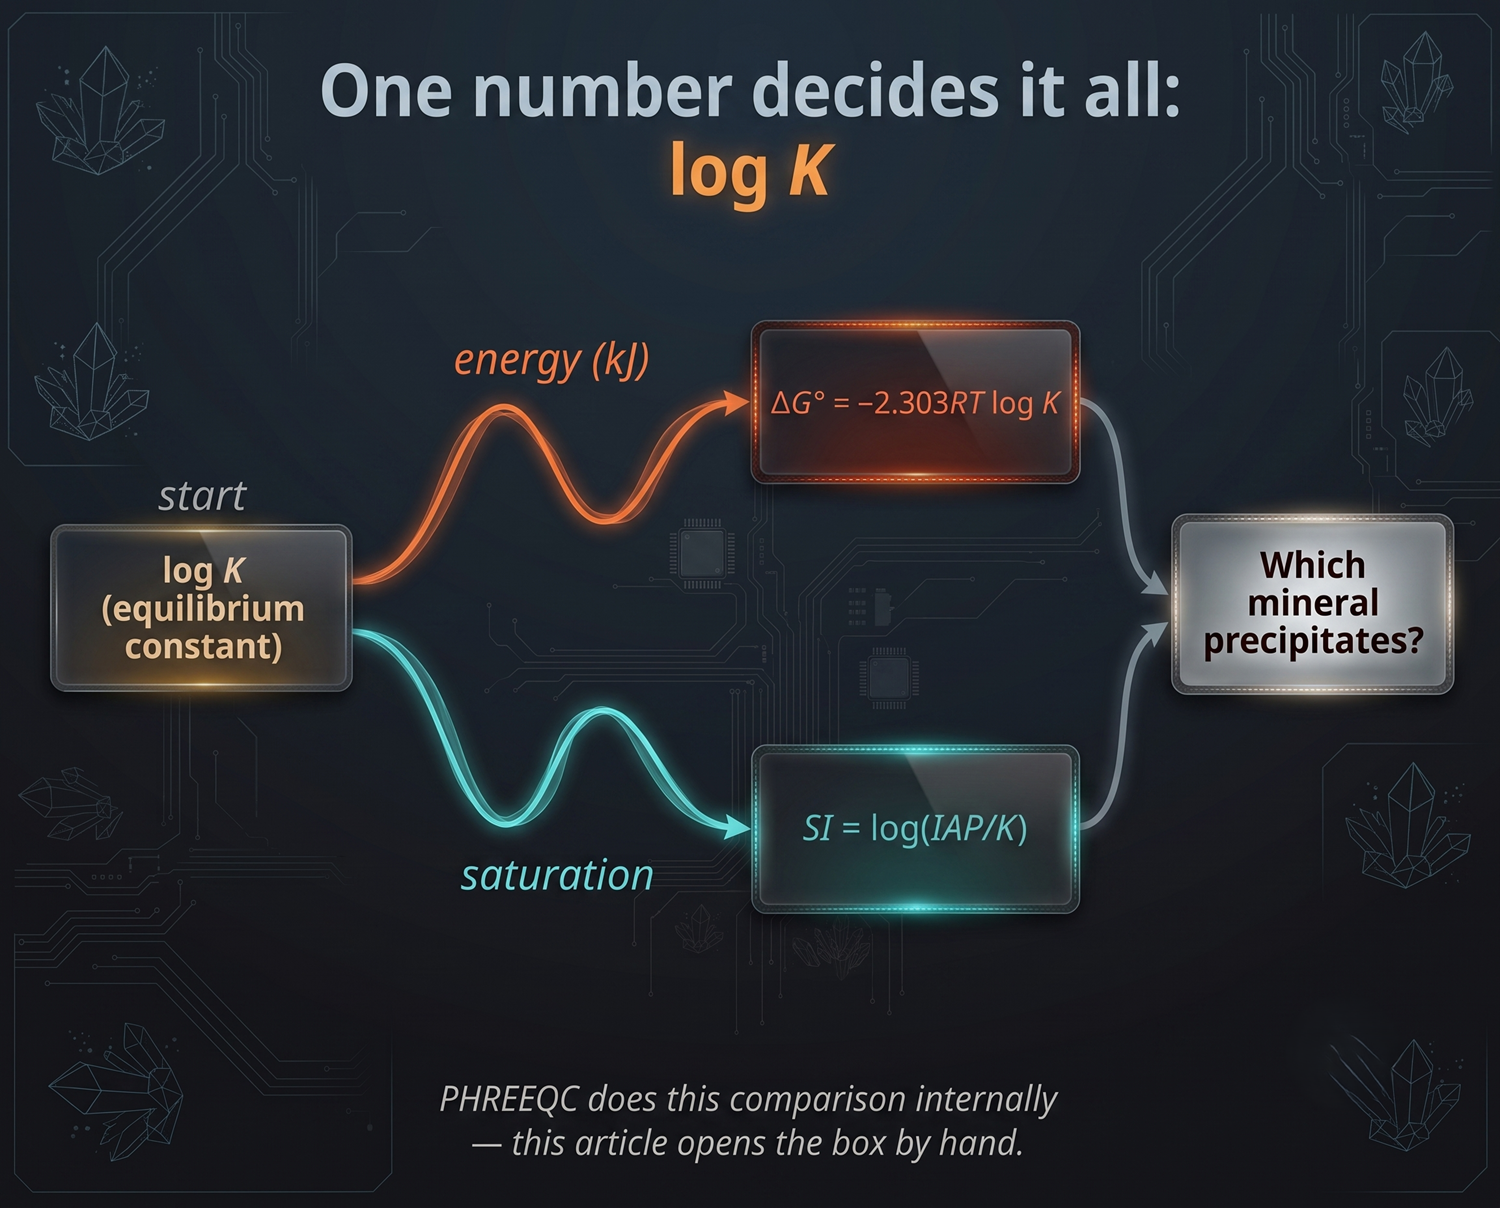
Across the basalt-CO2 series so far (#17 CarbFix reproduction, #18 Satake et al. 2025 reproduction), we used reaction kinetics (KINETICS) to track how fast the primary minerals dissolve. But which secondary mineral actually precipitates from the released ions — calcite, a smectite, a zeolite — is not decided by kinetics. That judgement rests entirely on a single number written in the database: the base-10 logarithm of the equilibrium constant, log K.
Just by listing mineral names under EQUILIBRIUM_PHASES, PHREEQC decides for you whether each one “comes out or not.” Internally, however, it is quietly comparing Gibbs free energies through log K. The goal of this article is to open that black box by hand. Once you can read log K, the “winners and losers” among minerals can be explained with paper and pencil.
As material we reuse the results of two reproduction studies already published in this series — the basalt batch reaction of Satake et al. (2025) (Satake et al. 2025) at 250 °C, and a CarbFix-type titration model based on Gysi (2017) (Gysi 2017). Every log K value used here is taken from the public Thermoddem database (Blanc et al. 2012).
1. The Equilibrium Constant and Gibbs Free Energy — a Single Master Equation
Everything starts from one relation. The Gibbs free energy \(\Delta G^\circ\) and the equilibrium constant \(K\) are linked by:
\[ \Delta G^\circ = -2.303\,RT \log K \]
\(\Delta G\) tells you whether a reaction runs downhill or uphill. Negative means downhill (spontaneous); positive means uphill (does not proceed). The factor \(2.303\,RT\) is the conversion “how many kJ does the energy move when log K changes by 1,” and it is set by temperature.
| Temperature | \(2.303\,RT\) (kJ/mol per unit of log K) |
|---|---|
| 25 °C | 5.71 |
| 100 °C | 7.14 |
| 250 °C | 10.02 |
The only sign rule you must hold onto:
- log K positive → ΔG negative → downhill / stable (proceeds in that direction)
- log K negative → ΔG positive → uphill / unstable (does not proceed)
With this one equation, energy and relative stability all follow.
2. What log K Really Is — “a Ratio of Activities at Equilibrium”
The equilibrium constant \(K\) is “the ratio of the activities of the products to the activities of the reactants, at equilibrium.” Activity can be thought of as an “effective concentration.”
One rule is decisive: pure solids (minerals) and water are assigned activity = 1, because they are pure substances. So in the expression, solids and water become “1” and drop out.
Take quartz, step by step. Its dissolution reaction and log K in Thermoddem are:
Quartz(alpha): SiO2 + 2H2O = H4SiO4 log K = -3.734Write out \(K\) in full, as “activity of products ÷ activity of reactants.” For \(\mathrm{SiO_2 + 2H_2O = H_4SiO_4}\), the product is \(\mathrm{H_4SiO_4}\) and the reactants are \(\mathrm{SiO_2}\) and \(\mathrm{H_2O}\):
\[ K = \frac{a(\mathrm{H_4SiO_4})}{a(\mathrm{SiO_2}) \cdot a(\mathrm{H_2O})^2} \]
Now apply the rule from above: \(\mathrm{SiO_2}\) is a pure solid so \(a(\mathrm{SiO_2}) = 1\), and \(a(\mathrm{H_2O}) \approx 1\). The entire denominator becomes 1 and drops out, leaving:
\[ K = a(\mathrm{H_4SiO_4}) = 10^{\log K} = 10^{-3.734} \approx 1.8 \times 10^{-4} \]
That is: “the activity of dissolved silica (\(\mathrm{H_4SiO_4}\)) in water at equilibrium with quartz is \(1.8 \times 10^{-4}\)” — the solubility of quartz. A log K value carries a concrete equilibrium number behind it.
A pH-sensitive mineral — calcite
Now a pH-dependent case. The dissolution of calcite is:
Calcite: CaCO3 + H+ = Ca2+ + HCO3- log K = 1.847Write out its equilibrium constant the same way. For \(\mathrm{CaCO_3 + H^+ = Ca^{2+} + HCO_3^-}\), the products are \(\mathrm{Ca^{2+}}\) and \(\mathrm{HCO_3^-}\), and the reactants are the solid \(\mathrm{CaCO_3}\) and \(\mathrm{H^+}\):
\[ K = \frac{a(\mathrm{Ca^{2+}}) \cdot a(\mathrm{HCO_3^-})}{a(\mathrm{CaCO_3}) \cdot a(\mathrm{H^+})} = \frac{a(\mathrm{Ca^{2+}}) \cdot a(\mathrm{HCO_3^-})}{a(\mathrm{H^+})} \]
The solid \(\mathrm{CaCO_3}\) cancels as 1, but this time \(a(\mathrm{H^+})\) survives in the denominator. That is the crucial difference from quartz — the pH lever.
Writing this as a saturation index — the log of the ratio of the present water’s IAP to \(K\), \(\mathrm{SI} = \log(\mathrm{IAP}/K)\) (see §3) — and using the definition \(-\log a(\mathrm{H^+}) = \mathrm{pH}\):
\[ \mathrm{SI} = \log a(\mathrm{Ca^{2+}}) + \log a(\mathrm{HCO_3^-}) \underbrace{-\,\log a(\mathrm{H^+})}_{=\,+\mathrm{pH}} - 1.847 = \log a(\mathrm{Ca^{2+}}) + \log a(\mathrm{HCO_3^-}) + \mathrm{pH} - 1.847 \]
So pH enters SI with a coefficient of +1: raise pH by 1 and SI rises by 1 (i.e. ten-fold more supersaturated). This is the real mechanism behind “calcite precipitates as pH rises.”
For example, with \(a(\mathrm{Ca^{2+}}) = a(\mathrm{HCO_3^-}) = 10^{-3}\), we get \(\mathrm{SI} = \mathrm{pH} - 7.847\), and moving pH alone flips precipitation on and off:
| pH | SI = pH − 7.847 | Behavior |
|---|---|---|
| 6 | −1.85 | undersaturated → calcite dissolves |
| 7 | −0.85 | still undersaturated |
| 8 | +0.15 | supersaturated → calcite precipitates |
| 9 | +1.15 | strongly supersaturated → more precipitation |
In a basalt-CO2 system, calcite precipitates as CO2 is consumed and pH rises — exactly this mechanism.
3. IAP and SI — How Far Is “the Present Water” from Equilibrium?
\(K\) was the ratio at equilibrium. The ion activity product (IAP) is the same expression evaluated with the activities of the present solution. Same form as \(K\); only the contents differ (equilibrium values vs. current values). The logarithm of their ratio is the SI:
\[ \mathrm{SI} = \log \left( \frac{\mathrm{IAP}}{K} \right) \]
- SI > 0: the present water is more concentrated than equilibrium → supersaturated → the mineral precipitates
- SI = 0: exactly at equilibrium (saturated)
- SI < 0: the present water is dilute → undersaturated → nothing forms (existing crystals dissolve)
Let us do it once with numbers. From §2, quartz equilibrium is \(K = 10^{-3.734}\). Suppose some water has a silica activity of \(a(\mathrm{H_4SiO_4}) = 10^{-3.0}\) (more concentrated than equilibrium). The IAP is just the same expression with the present value, \(\mathrm{IAP} = 10^{-3.0}\), so:
\[ \mathrm{SI} = \log\frac{\mathrm{IAP}}{K} = \log 10^{-3.0} - \log 10^{-3.734} = (-3.0) - (-3.734) = +0.734 \]
SI > 0, so it is supersaturated and quartz precipitates. Since \(10^{+0.734} \approx 5.4\), the present water is about 5.4 times more concentrated than equilibrium. (The trick: dividing inside a log becomes subtracting the exponents.)
SI also converts to energy — another member of the master-equation family:
\[ \text{driving force for precipitation} = 2.303\,RT \cdot \mathrm{SI} \]
The order in which to read an SI value:
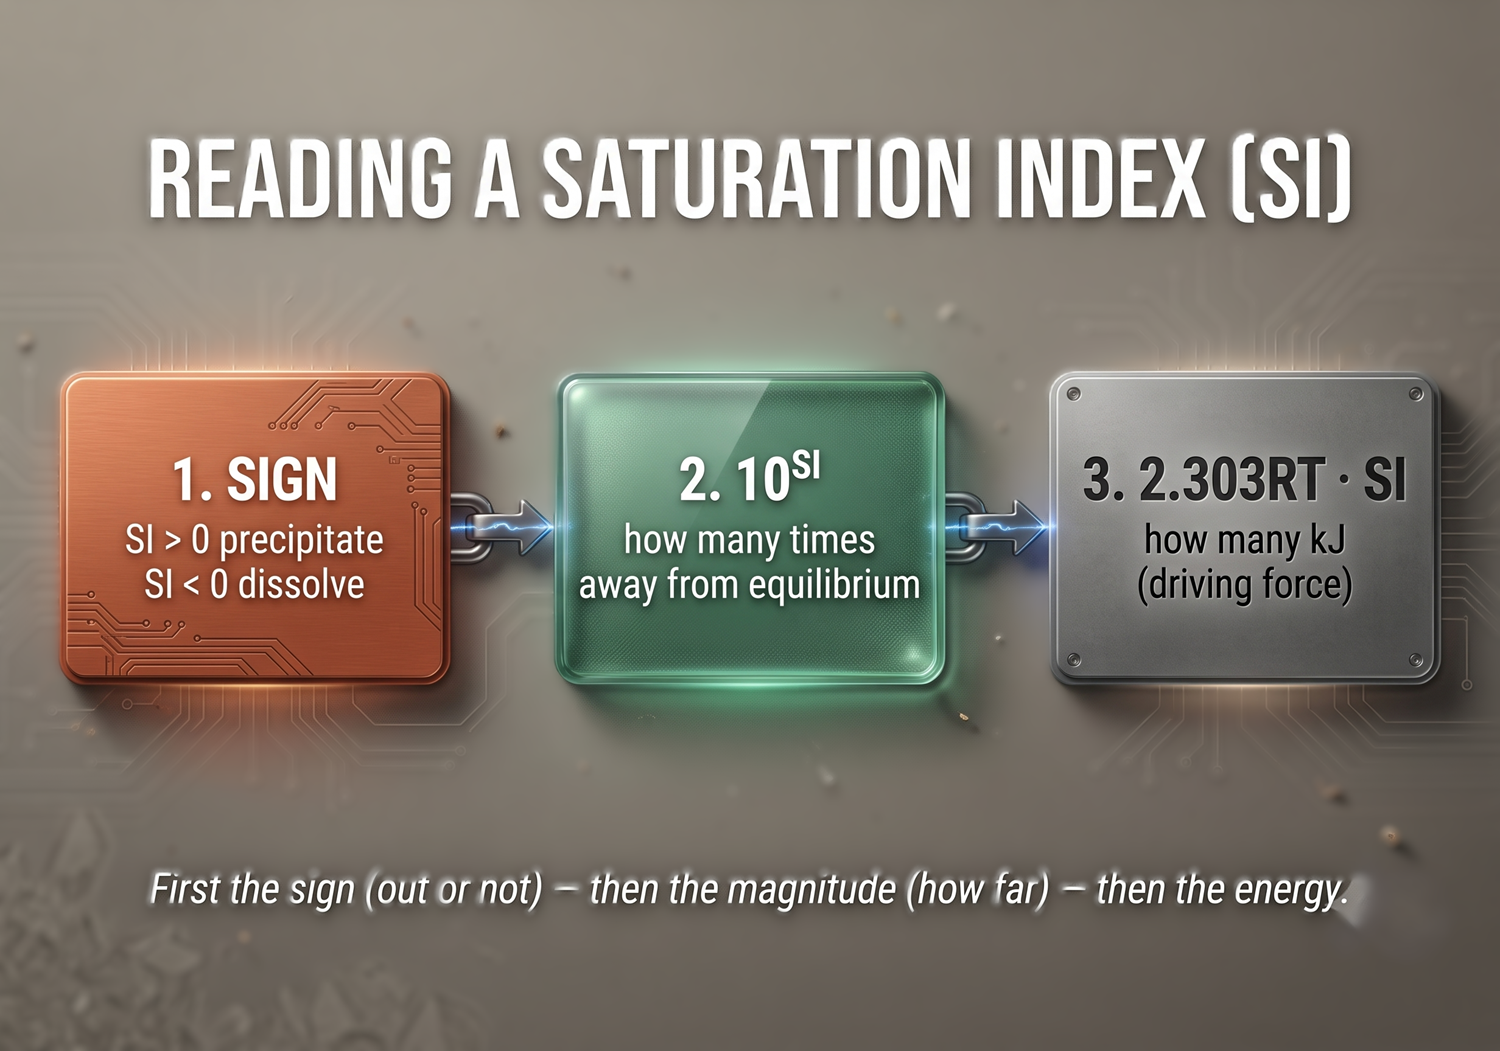
First the sign (out or not), then \(10^{\mathrm{SI}}\) (how many times off), then \(2.303\,RT \times \mathrm{SI}\) (how many kJ).
4. Combining Reactions — Hess’s Law
Here is the heart of it. Comparing minerals means adding and subtracting reactions, which means adding and subtracting their log K. Three rules:
| Operation on the reaction | log K becomes… |
|---|---|
| Reverse the reaction | flip the sign (+ ↔︎ −) |
| Multiply by n | multiply by n |
| Add reactions | add (K multiplies = log adds) |
Then cancel anything that appears identically on both sides. As a basic case, build the reaction of anorthite converting to kaolinite, using the Thermoddem 25 °C dissolution reactions:
(1) Anorthite + 8H+ = 2Al3+ + Ca2+ + 2H4SiO4      log K = +24.235
(2) Kaolinite + 6H+ = 2Al3+ + 2H4SiO4 + H2O        log K = +6.483
The aim is to merge anorthite and kaolinite into a single equation. To do that, reverse \((2)\) (flip the sign of its log K to \(-6.483\)) and add it to \((1)\) as is.
  (1) as is    :  Anorthite + 8H+          = 2Al3+ + Ca2+ + 2H4SiO4    (+24.235)
  (2) reversed :  2Al3+ + 2H4SiO4 + H2O    = Kaolinite + 6H+           (-6.483)
  ──────────────────────────────────────────────────────────────
  sum          :  Anorthite + 8H+ + 2Al3+ + 2H4SiO4 + H2O
                    = 2Al3+ + Ca2+ + 2H4SiO4 + Kaolinite + 6H+
Now cancel each species that appears identically on both sides:
- \(2\mathrm{Al^{3+}}\) … 2 on the left, 2 on the right → cancels
- \(2\mathrm{H_4SiO_4}\) … 2 on the left, 2 on the right → cancels
- \(\mathrm{H^+}\) … 8 on the left, 6 on the right → net 2 remain on the left
After cancelling, one equation remains:
\[ \text{Anorthite} + 2\mathrm{H^+} + \mathrm{H_2O} = \text{Kaolinite} + \mathrm{Ca^{2+}} \]
The log K is simply the sum in the directions used (the \(+24.235\) of \((1)\) as is, plus the \(-6.483\) of \((2)\) reversed):
\[ \log K = 24.235 - 6.483 = +17.75 \]
log K = +17.75, i.e. \(\Delta G^\circ(25℃) = -2.303\,RT \times \log K \approx -5.71 \times 17.75 \approx -101\) kJ/mol — a steep downhill. The Al in anorthite drops happily into kaolinite.
5. Example B: This Is CO2 Fixation Itself — Anorthite + CO2 → Calcite + Kaolinite
Let us write the “mineral fixation of CO2” that CarbFix and Satake target, in the language of log K. Add the CO2 dissolution reaction and calcite to the materials:
(1) Anorthite + 8H+ = 2Al3+ + Ca2+ + 2H4SiO4      +24.235
(2) Kaolinite + 6H+ = 2Al3+ + 2H4SiO4 + H2O        +6.483
(3) Calcite + H+ = Ca2+ + HCO3-                     +1.847
(4) CO2 + H2O = HCO3- + H+                          -7.821
This time we combine four reactions. The goal is to leave only anorthite, CO2, calcite and kaolinite, cancelling every intermediate ion. Take \((1)\) as is, \((2)\) and \((3)\) reversed, and \((4)\) as is, and add them:
  (1) as is    :  Anorthite + 8H+       = 2Al3+ + Ca2+ + 2H4SiO4    (+24.235)
  (2) reversed :  2Al3+ + 2H4SiO4 + H2O = Kaolinite + 6H+           (-6.483)
  (3) reversed :  Ca2+ + HCO3-          = Calcite + H+              (-1.847)
  (4) as is    :  CO2 + H2O             = HCO3- + H+                (-7.821)
Check the species that cancel, one by one:
- \(2\mathrm{Al^{3+}}\) (2 each side), \(2\mathrm{H_4SiO_4}\) (2 each side), \(\mathrm{Ca^{2+}}\) (1 each side), \(\mathrm{HCO_3^-}\) (1 each side) … all cancel
- \(\mathrm{H^+}\) … 8 on the left from \((1)\), and \(6+1+1 = 8\) on the right from \((2)(3)(4)\) → exactly cancels
- \(\mathrm{H_2O}\) … 2 remain on the left, from \((2)\) and \((4)\)
What remains is CO2 fixation itself:
\[ \text{Anorthite} + \mathrm{CO_2} + 2\mathrm{H_2O} = \text{Calcite} + \text{Kaolinite} \]
The log K is just the four terms added with their signs (\((1)\) plus, \((2)(3)(4)\) minus):
\[ \log K = 24.235 - 6.483 - 1.847 - 7.821 = +8.08 \]
\(\Delta G^\circ(25℃) \approx -5.71 \times 8.08 \approx -46\) kJ/mol, downhill. The primary mineral anorthite fixes CO2 as calcite, and the leftover Al becomes kaolinite. On paper, we can see this is a thermodynamically certain reaction.
Confirmation from real data (Satake et al. 2025 reproduction)
This is not a paper exercise only. Running the #18 Satake et al. (2025) reproduction model (Rishiri Island basalt, 250 °C) with saturation-index output for the secondary minerals, calcite reaches SI = 0 around day 4–5 of the reaction and keeps precipitating (final \(2.0 \times 10^{-4}\) mol).
The paper calculation and PHREEQC agree
The conclusion the log K arithmetic gave — “Anorthite + CO2 → Calcite is downhill” — is reproduced directly in the PHREEQC numerical experiment. Calcite’s SI climbs from negative to zero and then pins at zero (dissolution and precipitation in balance); that is the gold curve in the figure below. A reaction that log K correctly called “downhill” does indeed proceed.
6. Example C: The Carbonate Contest — Dolomite = Calcite + Magnesite
In CO2 fixation, not only calcite but also dolomite and magnesite are candidates. Which one appears? Again a subtraction of log K makes it visible:
(1) Dolomite  + 2H+ = Ca2+ + Mg2+ + 2HCO3-        +3.533
(2) Calcite   + H+  = Ca2+ + HCO3-                 +1.847
(3) Magnesite(Natur) + H+ = Mg2+ + HCO3-          +1.415
Build the equation that splits dolomite into calcite and magnesite. Take \((1)\) as is, and \((2)\) and \((3)\) reversed, and add:
  (1) as is    :  Dolomite + 2H+ = Ca2+ + Mg2+ + 2HCO3-    (+3.533)
  (2) reversed :  Ca2+ + HCO3-   = Calcite + H+            (-1.847)
  (3) reversed :  Mg2+ + HCO3-   = Magnesite + H+          (-1.415)
On both sides \(\mathrm{Ca^{2+}}\), \(\mathrm{Mg^{2+}}\), \(2\mathrm{HCO_3^-}\) and \(2\mathrm{H^+}\) all cancel, leaving only the solids:
\[ \text{Dolomite} = \text{Calcite} + \text{Magnesite} \] \[ \log K = 3.533 - 1.847 - 1.415 = +0.27 \]
log K = +0.27, \(\Delta G^\circ \approx -1.5\) kJ/mol — nearly a tie. The stability difference between dolomite and the “calcite + magnesite” pair is only a few kJ. Because the margin is so thin, which one actually appears depends strongly on the solution composition.
The final state of the Satake reproduction model (250 °C) shows how the tie breaks in practice:
| Mineral | Final SI | Behavior |
|---|---|---|
| Calcite | 0.00 | precipitates (\(2.0 \times 10^{-4}\) mol) |
| Dolomite | −0.79 | undersaturated — no precipitation |
| Magnesite(Natur) | −0.57 | undersaturated — no precipitation |
In this system calcite wins, while dolomite and magnesite fail to reach saturation. The role of the carbonate trap falling to calcite reflects both this log K near-tie and the limited Mg supply of the solution.
7. Example D: Smectite Competition — the Winner Is Set by “Element Supply”
Among secondary minerals, smectite (swelling clay) competition is a bit intricate. Here we use the measured SI evolution of the Satake reproduction model to follow “why one smectite forms while another does not.”
First compare the compositions of three smectite end-members (Thermoddem):
Saponite(FeMg) : Mg0.17 Mg2 Fe1 Al0.34 ...   log K = 26.022   <- contains Fe
Saponite(Mg)   : Mg0.17 Mg3   Al0.34 ...      log K = 28.810   <- no Fe
Montmorillonite(HcMg) : Al1.4 Mg0.9 ...        log K =  5.996   <- uses more Al
Saponite(FeMg) and Saponite(Mg) differ only by whether they contain Fe (in one, part of the Mg is replaced by Fe). That single point decides the contest.
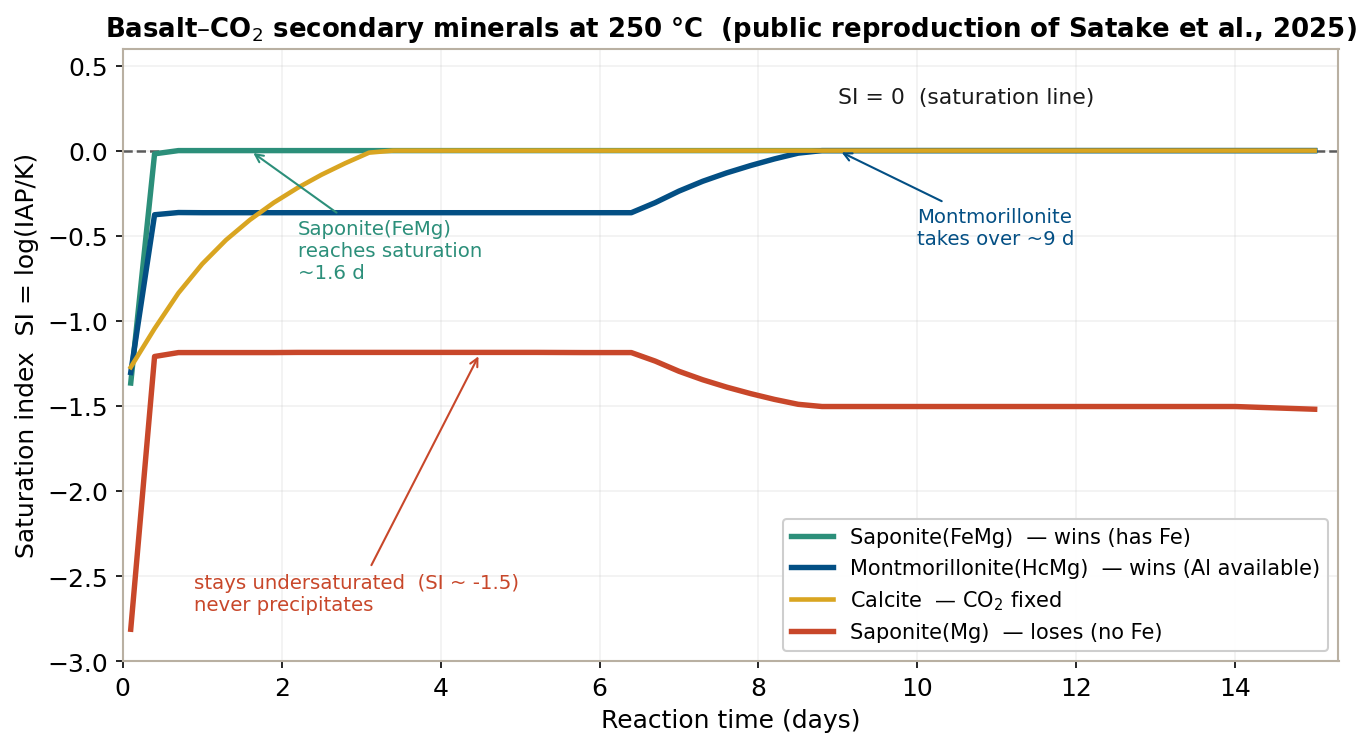
Reading the figure over time:
- Early reaction (~1 day): all minerals undersaturated (SI < 0). Nothing forms yet.
- ~1.6 days: Saponite(FeMg) reaches SI = 0 first and begins to precipitate. The primary mineral fayalite (\(\mathrm{Fe_2SiO_4}\)) dissolves and supplies Fe, so the material for the Fe-requiring Saponite(FeMg) is available.
- ~9 days: with a delay, Montmorillonite(HcMg) reaches SI = 0 and takes the lead thereafter (final \(9.8 \times 10^{-3}\) mol). Because Al is plentiful in solution, even the Al-heavy montmorillonite reaches saturation.
- Meanwhile, Saponite(Mg) stays at SI ≈ −1.5 and never precipitates. Why does it lose, when the near-identical Saponite(FeMg) forms?
Answer: the contest was decided by the supply of Fe
The only difference between Saponite(FeMg) and Saponite(Mg) is the presence of Fe. Here fayalite dissolves and supplies Fe, so the Fe-bearing Saponite(FeMg) reaches saturation, while the Fe-free Saponite(Mg) — even though its log K of 28.810 is larger than Saponite(FeMg)’s 26.022 (so it looks more stable at first glance) — cannot assemble the right combination of materials, and its SI stays negative.
Which phase appears is not decided by the size of log K alone. What matters is whether the elements the phase demands are actually supplied to the solution. This is precisely the theme running through this series: the roster of secondary minerals is set by element supply.
8. Example E: Zeolites and the “Activity of Water” — Laumontite and Wairakite
In the low-temperature CarbFix-type model (#17), zeolites cause trouble late in the run. A zeolite is distinctive in being governed not only by the supplied cations but by the activity of water itself, \(a(\mathrm{H_2O})\). We see this with laumontite and wairakite. Both share the same framework \(\mathrm{Ca(Al_2Si_4)O_{12}}\); only the number of water molecules taken into the crystal differs:
Laumontite ... ·4H2O Wairakite ... ·2H2OSo the supply of Ca, Al and Si does not decide between them — the activity of water does. Let us confirm this with an equation. Using the two dissolution reactions (Thermoddem, 25 °C) as materials, add \((1)\) as is and \((2)\) reversed:
  (1) as is    :  Laumontite + 8H+       = 2Al3+ + Ca2+ + 4H4SiO4   (+11.695)
  (2) reversed :  2Al3+ + Ca2+ + 4H4SiO4 = Wairakite + 8H+ + 2H2O   (-14.444)
On both sides \(2\mathrm{Al^{3+}}\), \(\mathrm{Ca^{2+}}\), \(4\mathrm{H_4SiO_4}\) and \(8\mathrm{H^+}\) all cancel, leaving only water:
\[ \text{Laumontite} = \text{Wairakite} + 2\mathrm{H_2O} \] \[ \log K = 11.695 - 14.444 = -2.75 \quad (25\,°\mathrm{C}) \]
With solid activities set to 1, only the product-side water survives, so \(K = a(\mathrm{H_2O})^2\). Solving \(K = a(\mathrm{H_2O})^2\) for the threshold water activity at which the two balance:
\[ a(\mathrm{H_2O}) = 10^{\,\log K / 2} = 10^{-2.75/2} \approx 0.042 \quad (25\,°\mathrm{C}) \]
At 25 °C the threshold is only 0.042. Ordinary dilute water (\(a(\mathrm{H_2O}) \approx 1\)) is far above it, so laumontite is overwhelmingly stable. Raising the temperature increases the dehydration log K and therefore the threshold. Computing the dehydration log K at each temperature in PHREEQC:
| Temperature | Dehydration log K | Threshold \(a(\mathrm{H_2O})\) | Stable phase in pure water (\(a\approx1\)) |
|---|---|---|---|
| 25 °C | −2.75 | 0.042 | Laumontite |
| 100 °C | −1.54 | 0.17 | Laumontite |
| 200 °C | −0.39 | 0.64 | Laumontite |
| 250 °C | +0.17 | 1.21 (>1) | Wairakite |
Plotting this threshold (third column) with temperature on the x-axis and water activity on the y-axis turns it into a phase diagram that shows at a glance which zeolite is stable. The black boundary is exactly the threshold we just computed.
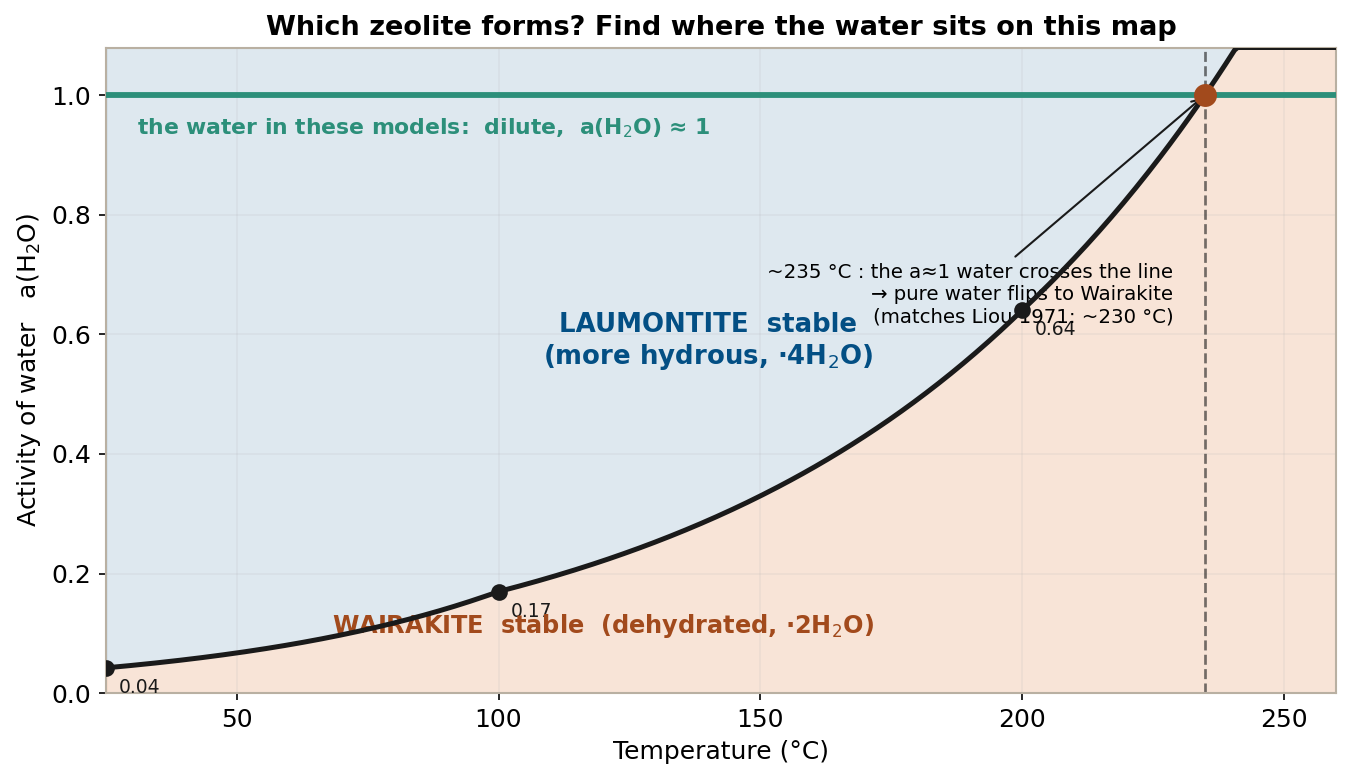
To read this figure you only locate “the present water” on the map — no need to read the dehydration log K directly.
- Fix the y-position — the groundwater in this series is dilute, so \(a(\mathrm{H_2O}) \approx 1\): it sits at the very top of the figure (the green line).
- See which colored field that line passes through — on the low-temperature side, the green line runs far above the boundary, i.e. through the laumontite field (blue). So laumontite is stable at low temperature and wairakite does not form.
- Trace to the right — as temperature rises the boundary climbs, and at about 235 °C it crosses the green line (a≈1). Beyond that point the green line enters the wairakite field (orange): even pure water converts to wairakite above ~235 °C.
This ~235 °C nearly matches the experimental phase boundary of Liou (1971) (Liou 1971) (about 230 °C). The only way to get wairakite at low temperature is to lower the green line, i.e. lower the water activity (high salinity, evaporation, dehydration). The difficulty of handling zeolites in low-temperature CarbFix systems has this delicate tug-of-war over water activity behind it.
9. [A Different Axis] There Is a Second Kind of “Does Not Form” — the Kinetic Wall
All the examples so far (Saponite(Mg) in D, wairakite in E) were cases where the constituent elements are in solution but saturation is never reached — a loss on thermodynamics (SI). But “does not form” has another kind: the material itself is not supplied to the solution.
| Type of “does not form” | What decides it |
|---|---|
| ① Material present but not saturated (thermodynamics) | \(\mathrm{SI} = \log(\mathrm{IAP}/K)\) (the world of log K) |
| ② Material not supplied (kinetics) | dissolution rate (KINETICS). Not decided by log K |
Type ② is the world governed by the effective reactive surface area (RSA) introduced in #18 and the basaltic-glass dissolution rate of #17. If the primary mineral that sources a given element is kinetically “hard” to dissolve, then a secondary mineral demanding that element cannot reach saturation no matter how large its log K. As Lasaga (1984) (Lasaga 1984) showed, the formation of secondary minerals is rate-limited by the dissolution of the primary minerals.
When you see “does not form,” ask first: is the material reaching the solution?
If it is, the contest is in the SI (log K) world. If it is not, the story is kinetics (KINETICS), and no amount of building reactions and computing log K will change the answer. Separating these two axes is decisive for reading the output of a geochemical model.
10. A Reusable Procedure
Finally, the procedure for comparing mineral stabilities with log K:
- Write out the dissolution reactions and log K of the relevant minerals from the database (
.dat). - Decide the reaction you want to build (ideally solids + water only, or solids + CO2, etc.).
- Combine: reverse = flip sign / multiply by n = multiply / add = add log K.
- Cancel the identical species on both sides (ions, H+, H4SiO4, etc.).
- Read the sign of the remaining log K: + = products stable (downhill) / − = reactants stable.
- Convert to kJ: \(\Delta G^\circ = -2.303\,RT \times \log K\) (5.71 at 25 °C, 7.14 at 100 °C, 10.02 at 250 °C).
Never compare raw log K values directly
Looking at the appendix table and reasoning “quartz is −3.7, anorthite is +24.2, so quartz is more stable” is wrong. Each reaction has a different number of H+ (8 vs 2) and a different number of Si, so raw log K values are different rulers. To compare minerals, always combine them into a single reaction by the §4 procedure (cancelling Al3+, H+, etc.). Only after cancellation is it an apples-to-apples comparison.
And the final call — “does this actually precipitate from this solution?” — is made not with log K but with SI (which needs the modeled activities). That is why examples B–D referred to real SI data.
Appendix: Thermoddem log K Used in This Article (25 °C, dissolution reactions)
All values are from the public Thermoddem database (Blanc et al. 2012).
| Mineral / species | Dissolution reaction | log K |
|---|---|---|
| Anorthite | CaAl2Si2O8 + 8H+ = 2Al3+ + Ca2+ + 2H4SiO4 | 24.235 |
| Kaolinite | Al2Si2O5(OH)4 + 6H+ = 2Al3+ + 2H4SiO4 + H2O | 6.483 |
| Quartz(alpha) | SiO2 + 2H2O = H4SiO4 | −3.734 |
| Calcite | CaCO3 + H+ = Ca2+ + HCO3- | 1.847 |
| Dolomite | CaMg(CO3)2 + 2H+ = Ca2+ + Mg2+ + 2HCO3- | 3.533 |
| Magnesite(Natur) | MgCO3 + H+ = Mg2+ + HCO3- | 1.415 |
| CO2 dissolution | CO2 + H2O = HCO3- + H+ | −7.821 |
| Laumontite | Ca(Al2Si4)O12·4H2O + 8H+ = 2Al3+ + Ca2+ + 4H4SiO4 | 11.695 |
| Wairakite | Ca(Al2Si4)O12·2H2O + 8H+ + 2H2O = 2Al3+ + Ca2+ + 4H4SiO4 | 14.444 |
| Saponite(FeMg) | (Fe-bearing end-member) | 26.022 |
| Saponite(Mg) | (Fe-free end-member) | 28.810 |
| Montmorillonite(HcMg) | (Al-heavy end-member) | 5.996 |
Note: do not compare these raw log K values directly between minerals (§10). Comparison must be done after forming a single reaction by the §4 procedure.
References
Note: the saturation indices (SI) referenced in this article were obtained by adding only SI output — with no change to the chemical conditions — to the already-published model of #18 (reproduction of Satake et al. 2025). All log K values are from the public Thermoddem database.