Today’s Theme
In previous speciation calculations, we investigated “what chemical forms existing ions take in a solution.” Today, we take a step further and calculate “what dissolves and what precipitates when solid minerals come into contact with water.”
The key to this calculation is the EQUILIBRIUM_PHASES block.
Our case study involves two calcium sulfate minerals: Gypsum and Anhydrite.
These two minerals share the same chemical components (Ca, S, O), but they possess a fascinating property: their thermodynamic stability flips depending on the temperature. Let’s verify this using PHREEQC.
What is EQUILIBRIUM_PHASES?
The EQUILIBRIUM_PHASES block is an instruction to “react this mineral with water until it reaches equilibrium.”
PHREEQC automatically calculates: - The amount of mineral to dissolve or precipitate until the Saturation Index (SI) becomes zero. - The resulting changes in pH, ion concentrations, and final mineral mass.
Initial_Amount = 10: Ensures enough mineral is "present" to saturate the water.
Simulation Scenario
The simulation follows these steps:
| Step | Content | PHREEQC Block |
|---|---|---|
| 1 | Define Pure Water (pH 7, 25°C) | SOLUTION |
| 2 | Add excess Gypsum and Anhydrite | EQUILIBRIUM_PHASES |
| 3 | Heat from 25°C to 75°C (1°C increments) | REACTION_TEMPERATURE |
| 4 | Record and Graph SI at each temperature | SELECTED_OUTPUT / USER_GRAPH |
GUI Procedure
Step 1: Define Pure Water
Using the same steps as before, set up default pure water (pH 7, pe 4, 25°C) via the SOLUTION icon.
SOLUTION 1
    temp      25
    pH        7
    pe        4
    redox     pe
    units     mmol/kgw
    density   1
    -water    1 # kg
Step 2: Configure EQUILIBRIUM_PHASES
Click the EQUILIBRIUM_PHASES icon on the left icon bar.
In the configuration window: 1. Check Anhydrite and Gypsum in the list. 2. Enter 0.0 for the Saturation Index (Target SI) of both. 3. Enter 10 for the Amount (Initial moles).
Amount is the initial quantity of the mineral in moles. 10 mol is a large excess, ensuring that enough mineral exists to saturate the water without completely dissolving.
Step 3: Configure REACTION_TEMPERATURE
To vary the temperature, click the REACTION_TEMPERATURE icon.
In the window: 1. Check Linear step. 2. Enter start temperature 25, end temperature 75, and number of steps 51 (for 1°C increments).
Full PHREEQC Code
The complete code generated by the GUI is as follows. You can copy and paste this directly into PHREEQC to run the simulation.
SOLUTION 1  Pure water
    temp      25
    pH        7
    pe        4
    redox     pe
    units     mmol/kgw
    density   1
    -water    1 # kg

EQUILIBRIUM_PHASES 1
    Anhydrite   0.0   10   # Aim for SI=0, with 10 mol initial
    Gypsum      0.0   10   # Aim for SI=0, with 10 mol initial

REACTION_TEMPERATURE 1
    25.0  75.0  in 51 steps   # From 25°C to 75°C in 1°C steps

SELECTED_OUTPUT 1
    -file             gypsum_anhydrite.sel
    -temperature      true
    -saturation_indices  Anhydrite  Gypsum

USER_GRAPH 1
    -headings  Temperature  SI_Anhydrite  SI_Gypsum
    -chart_title  "Gypsum vs Anhydrite: SI vs Temperature"
    -axis_titles  "Temperature (°C)"  "Saturation Index (SI)"
    -initial_solutions  false
    -start
    10  graph_x  TC
    20  graph_y  SI("Anhydrite")  SI("Gypsum")
    -end

ENDUSER_GRAPH is a feature exclusive to the GUI (Interactive) version of PHREEQC. graph_x specifies the X-axis value, and graph_y specifies the Y-axis values. TC is a built-in variable for temperature in Celsius.
Reading the Results
Upon execution, PHREEQC displays a graph of SI vs. Temperature. The .sel file output from SELECTED_OUTPUT contains a structured dataset like this:
temp    si_Gypsum    si_Anhydrite
25       0            -0.305
30       0            -0.250
35       0            -0.197
40       0            -0.145
45       0            -0.093
50       0            -0.043
55      -0.006         0
60      -0.054         0
65      -0.102         0
70      -0.148         0
75      -0.194         0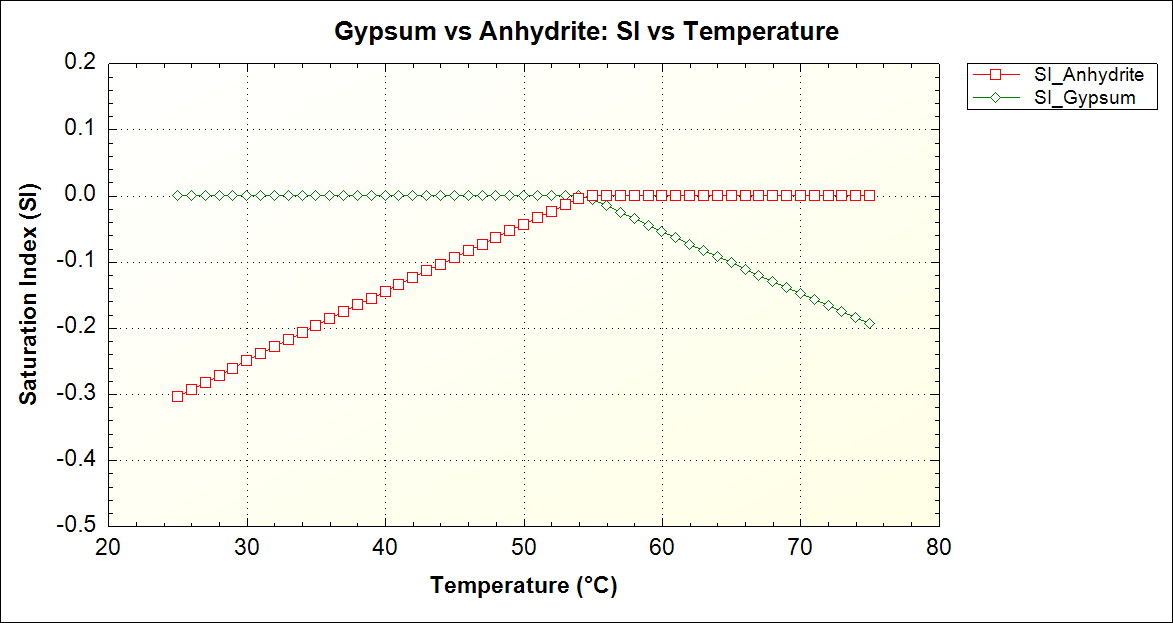
Discussion: Why Stability Flips with Temperature
The Saturation Index (SI) is defined as:
\[SI = \log \frac{IAP}{K_{sp}}\]
- \(SI\): Saturation Index \([-]\)
- \(IAP\): Ion Activity Product of the mineral components \([-]\)
- \(K_{sp}\): Thermodynamic Solubility Product at specific \(T\) and \(P\) \([-]\)
1. Gypsum is Stable at 25°C
At low temperatures, Gypsum (\(\mathrm{CaSO_4·2H_2O}\)), which incorporates water molecules into its crystal lattice, is more thermodynamically stable. Its SI is zero (equilibrium), while Anhydrite has a negative SI (undersaturated).
2. Inversion around 55°C
As temperature rises, the SI of Anhydrite increases toward zero, meaning its relative stability increases. Under these conditions, the stability of Gypsum and Anhydrite flips around 50–60°C.
3. Anhydrite is Stable at 75°C
At high temperatures, water molecules are released from the lattice, making \(\mathrm{CaSO_4}\) (Anhydrite) thermodynamically stable. This is a key reason why Anhydrite predominates in geothermal environments and deep geological formations used for CCS (Carbon Capture and Storage).
This phase transition corresponds to real-world geological phenomena. Anhydrite is dominant in deep sedimentary basins (high temperature), while Gypsum is more common in shallower environments (low temperature). In high-temperature CCS environments, CO₂ injection might cause temporary dissolution of Gypsum due to acidification, followed by the reprecipitation of Anhydrite depending on the temperature and water activity.
Key Points of EQUILIBRIUM_PHASES
Let’s summarize what we’ve learned from this calculation:
Next Time: Calcite–CO₂ Interaction
In the next tutorial, we will explore the difference between Open and Closed Systems by calculating the reaction between Calcite and CO₂ gas. We will track how the final pH changes depending on whether the system is open or closed to CO₂—one of the most critical reactions in understanding groundwater chemistry.